How to Design an Infographic on a Budget

Infographics are loved by those in media or marketing because they present complex information quickly and more importantly are highly shareable. If an infographic is done correctly it can work wonders for your business by gaining a much larger reach than other methods and giving you viral brand exposure.

Creating an infographic can be expensive, however there are methods that can be used to create an impressive Infographic without spending a fortune.

Do your own research

To cut down on costs it may be beneficial to get hold of your own relevant data. Many are put off by the thought of crawling the web themselves to find their own information, however there are many sites that offer a wealth of facts and statistics and most are free.

No matter how interesting your Infographic topic is, it will not succeed unless it has eye catching accurate information. So where can you get your hands on all this credible data? Here’s a list of useful, free sites that may be of use.

Create the right idea

Good data is the key to finding good ideas. It wouldn’t be wise to use just any data that you find on the web so if you do come across data from smaller independent sources make sure you contact them to confirm the information is accurate.

It’s also important to give you Infographic a great title, it must be catchy and attention grabbing. The title is the first thing that the viewer sees so it needs to be clear but also fun and exciting. Try and keep your information relatively simple and think in terms of design, if the data you have chosen doesn’t add value then it probably shouldn’t be used, the best infographics don’t need any explanation.

Your infographic needs to be interesting so try and make it fun, if you are interested you can also check out this blog and learn how to make your infographic more fun. It must provide the viewer with new content but also be entertaining at the same time so viewers will want to share it over and over again.

Use budget and free web based tools 

Substance and relevance of the content is so important when creating a good infographic, however design itself is also a key factor, using a infographic design service can produce brilliant results if you have well researched data that is appealing to your audience.

There are many budget/free web based tools that are readily available for those that want to create an infographic, make the most of them!

Easel.ly

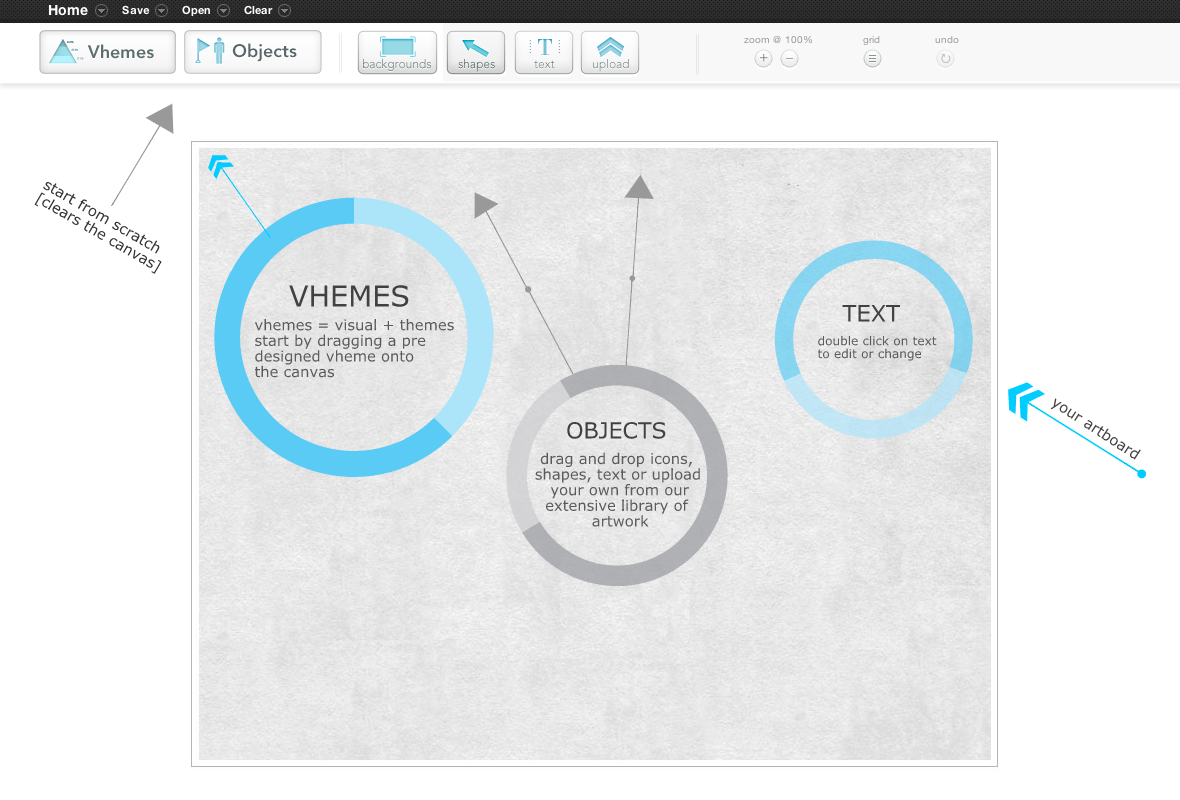
Easel.ly is a free web-based tool for creating infogrpahics. Their intuitive browser based infographic design GUI and Theme library makes creating an infographic easy, even for someone relatively new to design. Unfortunately you are unable to create graphs using real data but it is brilliant for conceptual visualizations and storytelling. It has some amazing themes and has a fantastic user interface. 

The variety of themes support many common purposes such as comparison and relationship graphing, maps and flowcharts. This tool has a selection of design objects and backgrounds, you can also upload your own images with the free version. 

Piktochart 

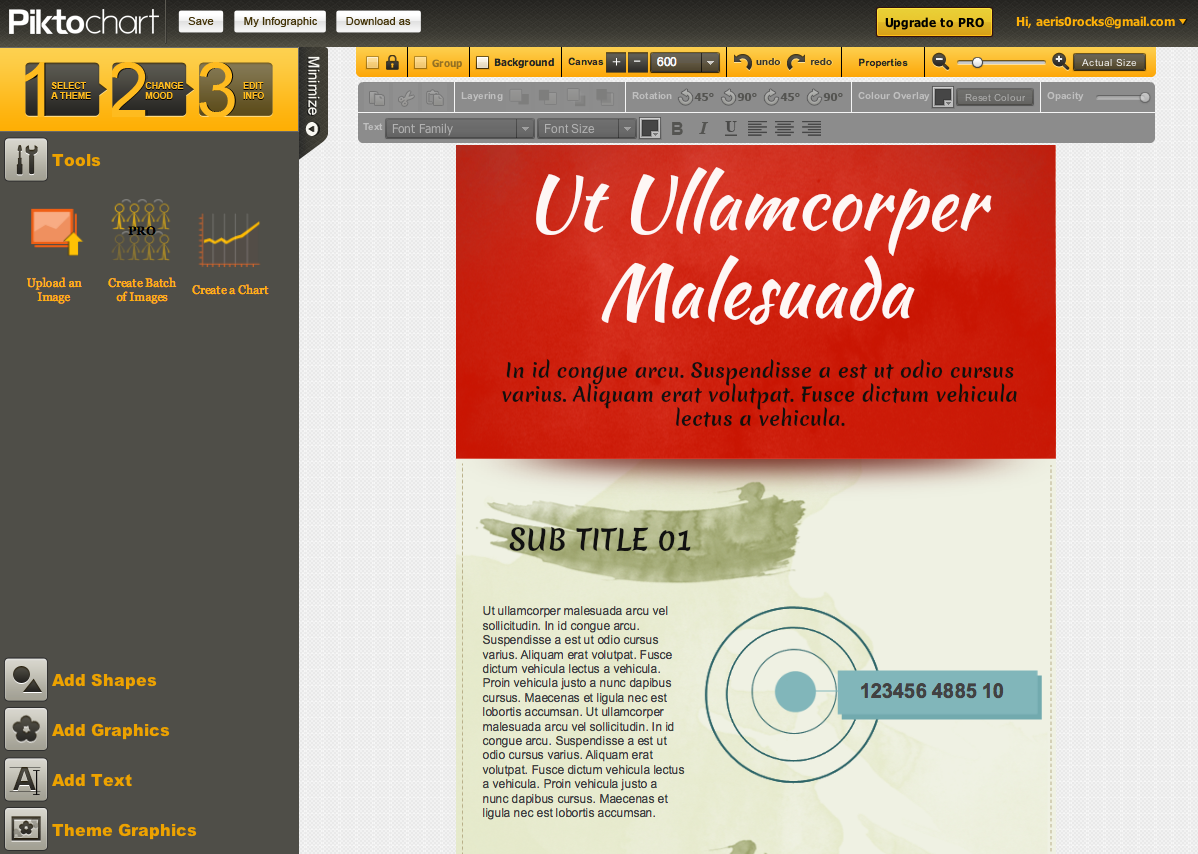
Piktochart is a web-based tool that not only has six decent free themes but also a whole bunch more for the paid version for creating simple visualizations. You can drag and drop different shapes and images, and there is quite a bit of customization available.

Another great thing about Piktochart is it’s ability to customize each element of the infographic theme you chose.  All aspects of the infographic can be moved around and placed in an order that’s right for you. They also have a lot of great documentation that will show you how to create an infographic using their new “Magical App”.

There are a few limitations in the way of fonts and some of the graphical elements that they provide. As a free member you have access to a limited of basic themes but if you wish to make more original designs then you would need to upgrade to their pro option.

OmniGraffle

This desktop application is unfortunately only offered on Mac and iPad, however the interface is very intuitive and is an effective tool for wireframing in detail. You are able to customize and stylize objects to the extent that you can use the tool to create whole infographics.

The tool offers a wide range of free downloadable stencils which make it really easy to diagram mobile and web interfaces. This tool isn’t free but is well worth the $99 if your looking to use a selection of graphs on you infographic.

Author: Tom Black – Head of Search at Bootcamp Media.
Free Infographic Resources : Comparing Easel.ly and Piktochart

Infographics are hot property right now, but if you r graphic design skills leave a lot to be desired, or you don’t have any suitable software available, there are two online tools available to help you to create professional-looking infographics for a variety of topics. Best of all, they’re both free.

http://www.easel.ly/

Quick Feature List:

  • Free tool.
  • 15 pre-designed theme templates.
  • Ability to upload own graphics.
  • Lots of objects/shapes to choose from.
  • Plenty of customisation options.
  • Can be white labelled.

After a quick and easy sign-up process, users are directed to the drag and drop infographic builder, which sustains a clear and effective workflow throughout, making it very simple to use, even for first-timers.

There are plenty of objects and shapes to use in your infographic project, and if the supplied graphics are not quite what you’re looking for, easel.ly provides an upload tool to add your own. Backgrounds and text are also customisable, with a fair amount of choice, sizes and styles.

Each element of the infographic can be positioned with accuracy, and the tool includes the ability to rotate and resize each. Once you are satisfied with the positioning, objects can be locked into place to avoid any user slip-ups!

Overall, this offering from easel.ly is extremely good for a free product. Shortcomings to note include not being able to control the size of the final infographic; currently, the shape of the finished project is similar to A4 and it would be great to have the ability to elongate the canvas, as is the style of most infographics.

http://piktochart.com/

Quick Feature List:

  • Free tool with pro option.
  • 6 pre-designed theme templates (50 with pro).
  • Ability to upload own graphics.
  • Graphics available according to theme.
  • Large fonts list.

The Piktochart interface can feel quite overwhelming when compared to easel.ly’s, the logic being that the available tools are all located in the toolbar, instead of appearing on click as per the easel.ly tools set.

Piktochart has some great advantages over easel.ly, such as handy controls for the canvas width and zoom feature. Piktochart also offers longer canvases – something notably lacking in the easel.ly tool.

Any deficiencies? Currently, only objects from the theme in use can be dropped into an open project, but this is set to change. The developers are also working on the functionality of exporting infographics as HTML downloads.

On the whole, Piktochart has provided a powerful infographic creation tool, and whilst the interface may look clunky in comparison to other tools available, it is by no means horrifying. The pro version is currently priced at $29 per month, or marketing, PR and social media agencies may prefer to choose the annual version which will save them 40% on the full retail price.

If you’re looking for an infographic tool that requires a little less work, you could try visual.ly, where you can create auto-generated infographics using the data from social media accounts or hashtags. Whichever infographic tool you choose; don’t forget to share your creation with Discover infographics!

Emm McAndrew is a social media account manager for Punch Communications. Punch is an integrated social media, PR and SEO agency based in the UK with a global client base. To find out how a digital PR agency could help your business, visit punchcomms.com. You can follow Emm on Twitter @twit_brit

Wanna write for us? Feel free to browse our guidelines and get in touch!

10 Free Resources for Creating Infographics

Here are ten free resources that you can use right now to improve and create your Infographics. There are tools that allow you to check upon the ranking progress of your Infographic. There are tools that allow you to create your Infographic from scratch, and tools that allow you to add graphical elements to your Infographic. There are also tools to add data filled elements to your Infographic, such as chart, diagrams and data filled images.

1 – GunnMap 

This is a great little device that will provide you with a map of the world. The map is colored in based upon the information you enter into it. It is great for if you need to give statistics for different countries. There is also no need to use the whole world; you can just use sections that are relevant to your information if you like. All you need to do it enter the name of the country and the associated number, and it will shade the countries on the map accordingly, so that the ones with the highest number are shaded the darkest.

2 – Hohli 

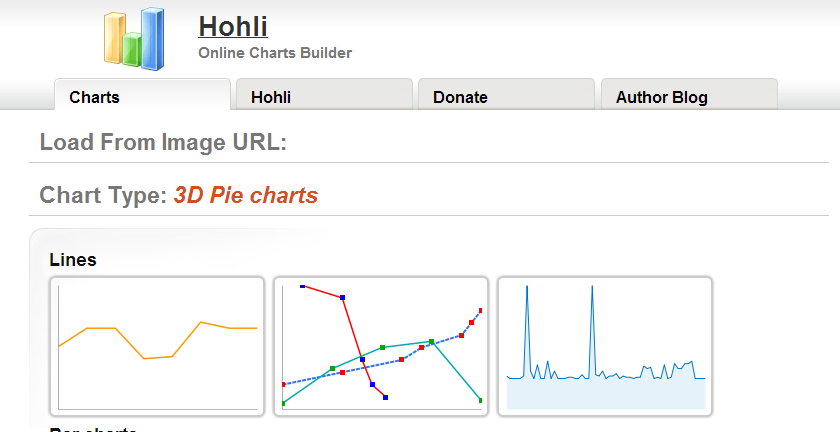
This is a chart creator. You can build an online chart by entering the numbers and details into the online tool. Pick the colors of the chart and any further modification. Once you have finished entering all your data you should click to build your chart. It puts it all together for you so that you do not have to arrange the information yourself.

3 – RSS Voyage

This is a good way to view your RSS feeds on Infographics. It allows you to take the RSS feeds of your preferred sites and then put them into a timeline so that both you and other people may see them.

4 – Juice Analytics

This is an analytic program that has more visuals than most analytic software. You can check up on the progress of your Infographic without being bored. The display is more pleasing to the eye. The main function of this is so that you do not miss any pertinent data, which you may have done if you were looking at more boring and plain web analytic displays.

5 – Infogr.am

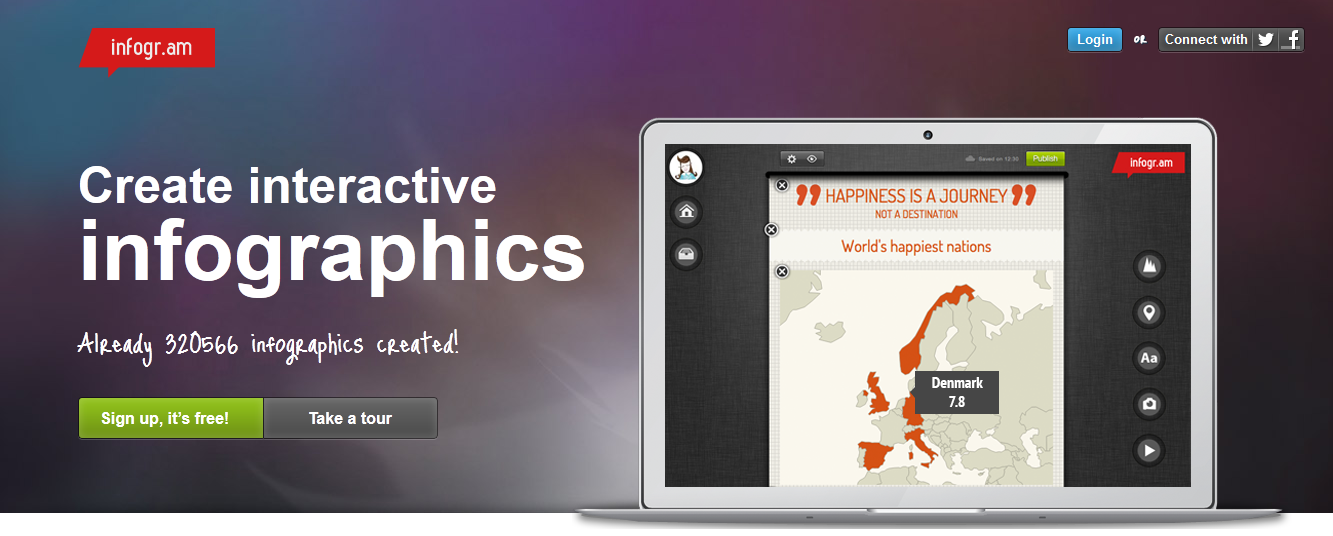
This is a tool that gives you a few pre-designed themes to help you get started with your Infographic. They are still developing this tool, so as you can imagine, the template selection is pretty limited. Nevertheless it is free, so one cannot complain too much.

6 – Piktochart

This is an Infographic designer, which is aimed at people who wish to create info graphics. It uses a very user-friendly modular design, which allows you to drag and drop shapes, text and images into your Infographic design.

7 – Creately

This is a great tool for creating an Infographic, which really focuses on data before visuals. We also know that Infographic data templates are making data more visually appealing, but sometimes you simply need to get the data in there. This is where Creately comes in. It is able to cram plenty of data into your Infographic without it looking cramped or confused. You can put in graphs and visualized data; you can put in flow charts and pie charts too. There is a wide range of graphs and data visualizations to choose from. You can use Venn diagrams, as well as family trees.

8 – Wordle

This is a tool that is also used by website designers. It turns your keywords into a cloud image, which is nicer to look at. This can be adapted for use with you Infographic so that certain words or data is bundled into this word cloud. It is very colorful and good looking.

9 – Diagram.ly

This is a good tool for the artistically natured Infographic creator. It allows you to draw diagrams without any form of template or background. You are simply able to draw your own diagrams for your Infographic. It is different from the “paint” program on your computer because it has other tools and graphics to help you draw with a better size perspective and three-dimensional perspective.

10 – Inkscape

This will allow you to draw images, which may then be used on your Infographic for free. It is a little bit like the Adobe illustrator.

Guest Post Author Bio: My name is Sonia Jackson. I represent the web-site http://www.custom-essay-writing.org. We’ll help you to solve all problems with writing different essays and research papers in a short time; we’ll answer all your questions and give you useful advice.