Infographics are hot property right now, but if you r graphic design skills leave a lot to be desired, or you don’t have any suitable software available, there are two online tools available to help you to create professional-looking infographics for a variety of topics. Best of all, they’re both free.
Quick Feature List:
- Free tool.
- 15 pre-designed theme templates.
- Ability to upload own graphics.
- Lots of objects/shapes to choose from.
- Plenty of customisation options.
- Can be white labelled.
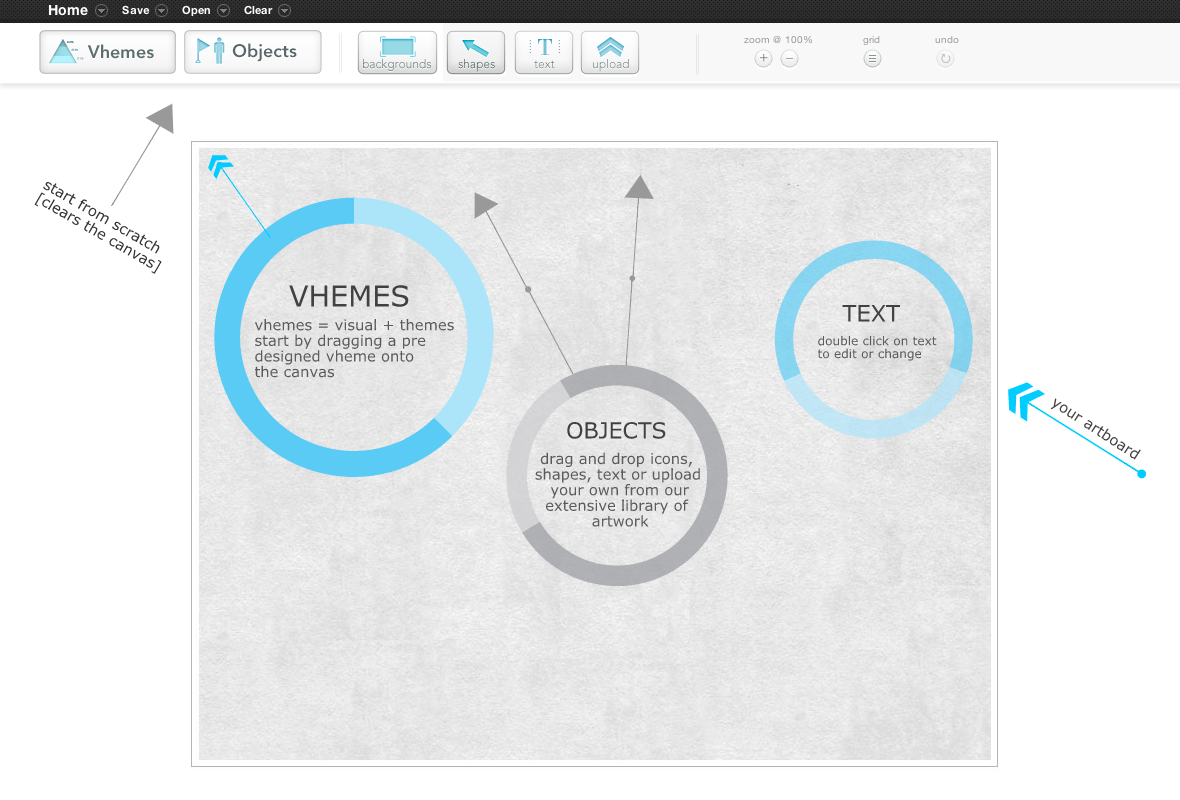
After a quick and easy sign-up process, users are directed to the drag and drop infographic builder, which sustains a clear and effective workflow throughout, making it very simple to use, even for first-timers.
There are plenty of objects and shapes to use in your infographic project, and if the supplied graphics are not quite what you’re looking for, easel.ly provides an upload tool to add your own. Backgrounds and text are also customisable, with a fair amount of choice, sizes and styles.
Each element of the infographic can be positioned with accuracy, and the tool includes the ability to rotate and resize each. Once you are satisfied with the positioning, objects can be locked into place to avoid any user slip-ups!
Overall, this offering from easel.ly is extremely good for a free product. Shortcomings to note include not being able to control the size of the final infographic; currently, the shape of the finished project is similar to A4 and it would be great to have the ability to elongate the canvas, as is the style of most infographics.
Quick Feature List:
- Free tool with pro option.
- 6 pre-designed theme templates (50 with pro).
- Ability to upload own graphics.
- Graphics available according to theme.
- Large fonts list.
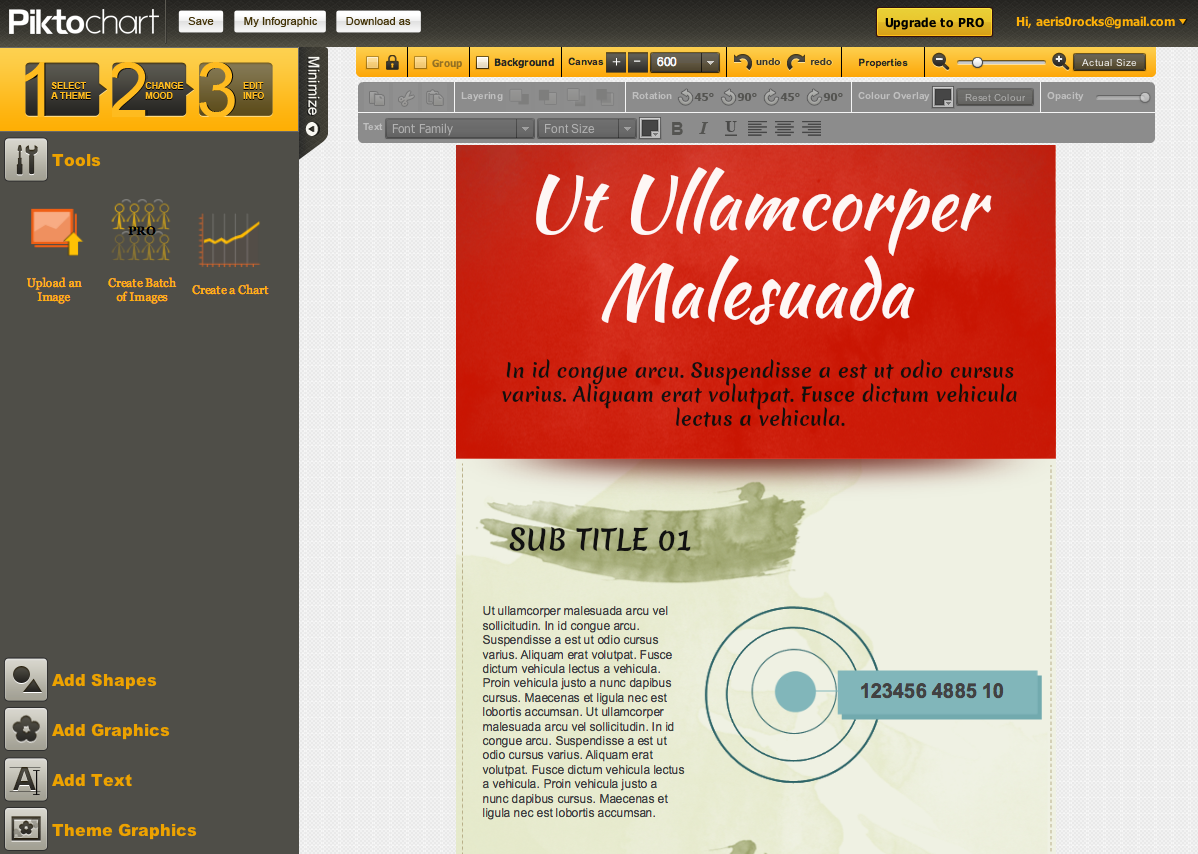
The Piktochart interface can feel quite overwhelming when compared to easel.ly’s, the logic being that the available tools are all located in the toolbar, instead of appearing on click as per the easel.ly tools set.
Piktochart has some great advantages over easel.ly, such as handy controls for the canvas width and zoom feature. Piktochart also offers longer canvases – something notably lacking in the easel.ly tool.
Any deficiencies? Currently, only objects from the theme in use can be dropped into an open project, but this is set to change. The developers are also working on the functionality of exporting infographics as HTML downloads.
On the whole, Piktochart has provided a powerful infographic creation tool, and whilst the interface may look clunky in comparison to other tools available, it is by no means horrifying. The pro version is currently priced at $29 per month, or marketing, PR and social media agencies may prefer to choose the annual version which will save them 40% on the full retail price.
If you’re looking for an infographic tool that requires a little less work, you could try visual.ly, where you can create auto-generated infographics using the data from social media accounts or hashtags. Whichever infographic tool you choose; don’t forget to share your creation with Discover infographics!
Emm McAndrew is a social media account manager for Punch Communications. Punch is an integrated social media, PR and SEO agency based in the UK with a global client base. To find out how a digital PR agency could help your business, visit punchcomms.com. You can follow Emm on Twitter @twit_brit
Wanna write for us? Feel free to browse our guidelines and get in touch!

